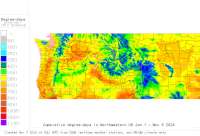
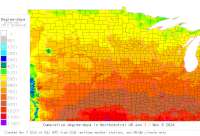
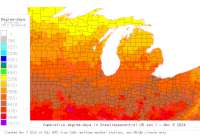
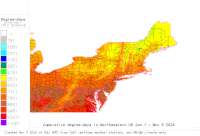
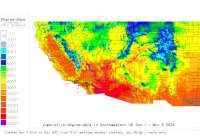
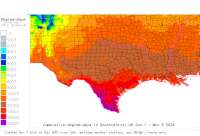
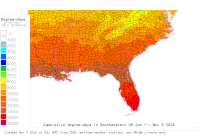
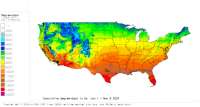
 (scroll down for index to Weather Network Tables and Pest Models)
| Tutorials currently available for these tools and access methods (requires FLASH player and AUDIO): | |||
|---|---|---|---|
| Tool (type of model) | |||
| Access method | DD Calculator (you enter parameters) | DD/Phenology models (70 spp., developed mainly for Western States) | Plant disease risk models |
| "MyPest Page" Interface | NEW Integrating multiple degree-day and disease risk models in a single interface, plus disease risk maps (16:50 min.) | ||
| Select station from Google map interface | Tutorial not available | NEW How to use the new Google Maps inferface to run Degree-day models (11:11 min.) | NA |
| Select station from state/network tables | Tutorial available (5.0 min.) | Tutorial not available | Tutorial Available (3.5 min.) |
| NEW: Spotted Wing Drosophila models: Pt. 1 - Phenology/Degree-Days, Pt. 2 - Overwintering Mortality | |||
|
NEW: How to use the usmapmaker Degree-day mapping program (9:44 min.)
Older version of degree-day mapping tutorial (7.0 min.) | |||
| Notes for running tutorials: Flash player required; Audio required to hear instructions; screen resolution should be a minimum of 1280x1024, also open your browser to full screen display to avoid missing information or need for scrolling. | |||
|
|
|
|
||||||||||||
|
|
|
|
||||||||||||
